

Prioritize Fixes: Conversion Rate Optimization for Arizona Businesses

Conversion rate optimization is the practice of turning more of your existing website visitors into customers, leads, or subscribers, without spending another dollar on traffic. The single biggest lever most Arizona business owners are ignoring: an audit of your highest-friction pages, usually the landing page a Google ad points to or the checkout flow itself. Fix that first, and everything else, testing, tools, personalization, gets easier.
TL;DR:
- Prioritize fixing page speed, checkout friction, and revealing total costs early to achieve measurable conversion improvements within two to four weeks.
- Focus on message match, social proof placement, and shortening forms to maximize landing page impact without complex testing.
- Use sufficient sample sizes and run full testing durations to avoid false positives, especially if monthly traffic is under 1,000 visits.
- Rely on qualitative feedback, session recordings, and user surveys to identify why visitors abandon pages when traffic is too low for statistical significance.
- Implement a hypothesis library, regular reporting, and dedicated accountability to develop a systematic, long-term CRO process.
Table of Contents
- What Is Conversion Rate Optimization and How Do You Calculate It?
- A Repeatable CRO Framework: Audit, Hypothesis, Prioritize, Test, Iterate
- Landing Page Optimization: Message Match, CTAs, and Social Proof
- A/B Testing Best Practices: Sample Size and Avoiding False Positives
- Which Tools and Metrics Actually Matter for CRO?
- Prioritized Checklist: What to Fix First
- Real-World CRO in Practice for Arizona Businesses
- Segmentation and Personalization Strategies That Improve Conversion Rates
- Beyond the Dashboard: Understanding Why Visitors Actually Leave
- How CRO Fits Into Your Broader Marketing and UX Strategy
- Post-Test Analysis: How to Act on Results Without Fooling Yourself
- Author Perspective: The Governance Gap Nobody Talks About
- How Webtechs Helps Scottsdale Businesses Turn Traffic Into Customers
- Sources
What Is Conversion Rate Optimization and How Do You Calculate It?
A conversion is whatever counts as a win on a given page: a purchase, a form submission, a demo request, a free trial signup. The math behind conversion rate optimization is simple: divide total conversions by total visitors, then multiply by 100. A landing page converts by dividing the number of completed purchases by visitors; for example, with 4,000 visitors and 120 purchases, the conversion rate is the result of that calculation without specifying the exact percentage.
Industry benchmarks are useful for context, not for setting goals. Unbounce’s data shows a median landing page conversion rate around the mid single digits, but that number blends every industry and traffic source imaginable. Your own historical baseline, last quarter’s rate on that same page, tells you far more about whether a change actually worked.
Typical conversion events look different by business model:
- Ecommerce: completed purchase, add to cart, email signup for a discount
- Lead generation: contact form submission, quote request, phone call click
- SaaS: free trial start, demo booking, paid plan upgrade
A Repeatable CRO Framework: Audit, Hypothesis, Prioritize, Test, Iterate
Random testing wastes budget. A structured loop doesn’t.
- Audit. Pull analytics, heatmaps, and session recordings to find where visitors drop off. The deliverable is a list of specific friction points, not a vague impression that “the site feels off.”
- Hypothesis. Write a testable statement: “Adding customer reviews above the checkout button will increase completed purchases because visitors are hesitating overtrust, not price.”
- Prioritize. Score each idea using a framework like ICE (Impact, Confidence, Ease) or PIE (Potential, Importance, Ease). A checkout fix scoring high on all three beats a homepage color change that only feels urgent.
- Test, learn, iterate. Run the experiment, record the outcome regardless of result, and feed it back into your next hypothesis.
Leadpages recommends running message match and QA checks before spending on traffic at all, since a broken or mismatched page will sink even the best ad campaign.
Pro Tip: If your site gets under roughly 1,000 monthly visits, skip formal A/B testing entirely and rely on session recordings, surveys, and direct customer feedback instead. You simply won’t hit statistical significance fast enough for a valid test.
Landing Page Optimization: Message Match, CTAs, and Social Proof
The fastest wins in conversion optimization techniques usually live on the landing page, not the homepage.
Message match means the headline and imagery a visitor lands on should mirror the ad, email, or search result that sent them there. A visitor who clicks “Scottsdale roof repair, same day quote” and lands on a generic “Contact Us” page will bounce.
- Keep the value proposition and a single primary call-to-action visible without scrolling.
- Cut every element competing for attention, extra navigation links, autoplay videos, unrelated offers.
- Shorten forms to only the fields you truly need to qualify a lead.
- Place a testimonial, review score, or trust badge close to the CTA button, not buried in a footer.
This lines up with what Shopify’s landing page guidance calls the core trio: message match, mobile-first layout, and social proof positioned where the decision actually happens.
A/B Testing Best Practices: Sample Size and Avoiding False Positives
A/B testing strategies only produce trustworthy data when you respect a few rules that most small business marketing calendars skip.
- Write one hypothesis per test and pick a single primary metric before launch, not conversion rate one week and revenue per visitor the next.
- Use a sample-size calculator to determine how long the test needs to run before you look at results; stopping early because a variant is “winning” on day three is the most common way programs generate false positives.
- Below roughly 1,000 monthly visits, structured A/B testing rarely reaches significance in a reasonable window, qualitative research fills that gap better.
- Avoid testing five variants at once unless your traffic can support it; multiple comparisons inflate your odds of a false winner.
- Let the test run the full planned duration, including a full business cycle, before declaring a result.
A/B testing and structured experimentation are foundational to reliable conversion rate optimization, but only when the sample size and stopping rules are respected.
Which Tools and Metrics Actually Matter for CRO?
You don’t need a dozen platforms. You need the right handful, watching the right numbers.
- Core metrics: conversion rate by page and traffic source, funnel drop-off rate, average order value, customer acquisition cost, lifetime value, and statistical confidence on any live test.
- Analytics: GA4 for funnel and source-level tracking.
- Behavior tools: heatmaps and session recordings to see where visitors hesitate or abandon.
- Experiment platforms: dedicated A/B testing software to manage variants and calculate significance.
- Speed tools: page-speed testing to catch the technical drag that kills conversions before a visitor even sees your offer.
Tie every test result back to revenue and lead quality, not just raw conversion count. A form that generates more submissions but worse leads isn’t a win.
Prioritized Checklist: What to Fix First
Not every fix deserves equal attention. Rank by impact against effort.
- Page speed. Even small load-time improvements correlate with meaningful conversion lift; compress images and defer non-critical scripts first.
- Checkout and form friction. Cut unnecessary fields and add guest checkout; Baymard’s research identifies form length and forced account creation as among the largest single lift opportunities in checkout UX.
- Surface total costs early. Hidden shipping or fees at the final step is one of the most common reasons carts get abandoned.
- Message match. Align every ad and landing page headline before you spend another dollar on traffic.
- Social proof near the CTA. Move your best review or trust signal next to the button, not below the fold.
Statistic Callout: Improving your conversion rate from 2% to 4% doesn’t just double leads, it doubles output from the same ad spend, directly lowering your cost per acquisition.
Expect visible movement on speed and checkout fixes within two to four weeks of launch; message match and social proof changes often show impact faster since they affect first impression, not deeper flow.
Real-World CRO in Practice for Arizona Businesses
Many agencies have built and optimized websites for small and mid-sized businesses, and the pattern holds across nearly every project: structural fixes beat cosmetic ones. The RV insurance case study shows the kind of compounding growth possible when SEO and conversion work move together rather than in isolation.
A typical audit looks at:
- Page speed and mobile rendering across the funnel
- Checkout or form friction points, using session recordings and heatmap data
- Message match between ad copy, search intent, and the landing page it points to
- A prioritized backlog scored by impact versus effort, not gut feeling
Arizona business owners can request a practical audit that documents these friction points and builds a testing roadmap around them, without promising overnight miracles. Reviewing past project results is a reasonable next step before committing budget to any changes.
Segmentation and Personalization Strategies That Improve Conversion Rates
Not every visitor deserves the same landing page. A first-time visitor from a Google search and a returning customer clicking an email link are at completely different points in the decision process, and treating them identically wastes the advantage you already have.
Start with the segments you can measure cleanly: traffic source, device type, new versus returning visitor, and geographic location. A Scottsdale HVAC company can serve a different headline to someone searching “AC repair near me” during a July heat wave versus someone browsing maintenance plans in February. That’s segmentation doing the heavy lifting before personalization even enters the picture.
Personalization layers on top once the fundamentals work. Dynamic content blocks that swap based on referral source, location-aware offers, or product recommendations based on browsing behavior can meaningfully lift conversion once your core page already converts well. AI-driven personalization tends to add somewhere in the range of 5% to 15% in incremental revenue when layered on top of a page that already has solid message match and a fast load time. It does nothing for a page that’s slow or confusing to begin with.
The mistake most businesses make is reaching for personalization tools before fixing the basics. Segmenting your email list by purchase history is worthless if the landing page it points to still takes six seconds to load. Sequence the work: get the fundamentals right for every visitor first, then layer segmentation and personalization on top for the segments that show the clearest behavioral differences.
Beyond the Dashboard: Understanding Why Visitors Actually Leave
Analytics tells you where people drop off. It rarely tells you why.
Session recordings show you the mouse hovering over a shipping cost field right before someone abandons a cart, but you still have to infer the reason. Closing that gap takes direct input from real visitors, not just aggregate numbers.
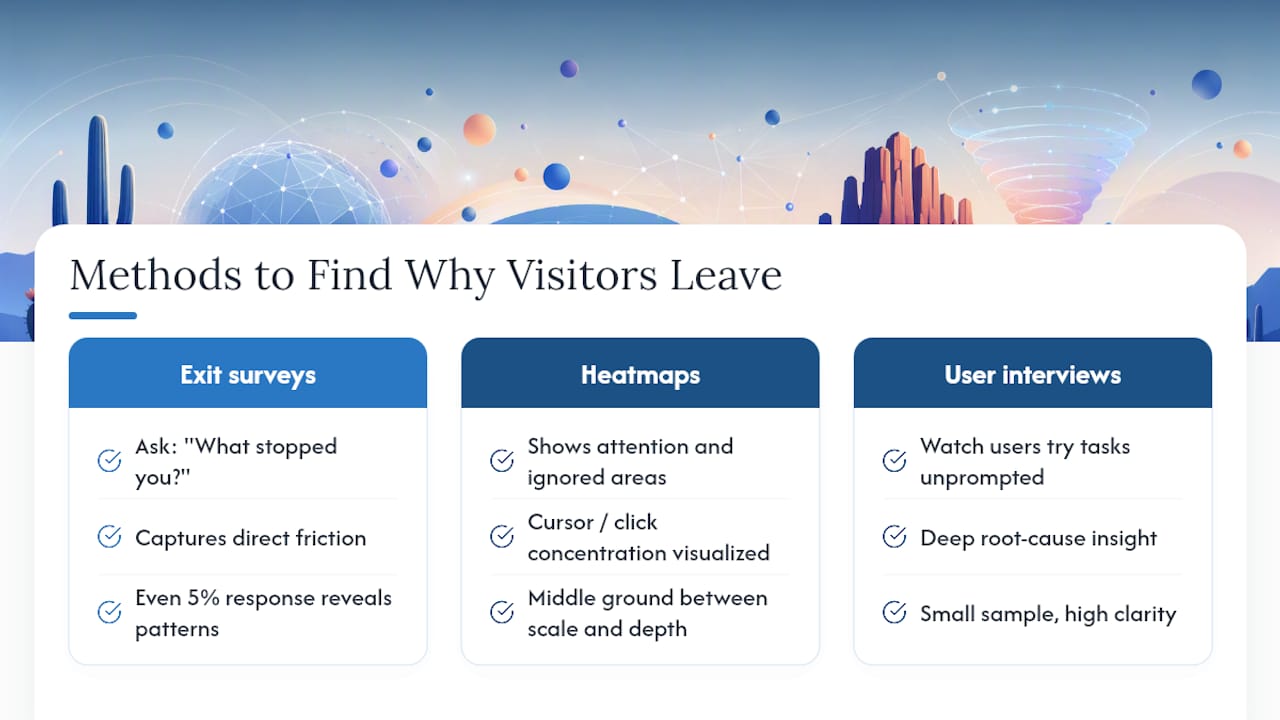
A short on-exit survey, “What stopped you from completing your purchase today?”, captures friction that no dashboard will surface. Even a 5% response rate on a low-traffic page can reveal a pattern: three separate visitors mentioning confusing pricing tells you more than a funnel report showing a 40% drop at that step.
User interviews go deeper still. Watching five real customers try to complete a purchase or fill out a quote form, without any prompting, exposes friction points that internal teams stop noticing because they’ve seen the page a hundred times. It’s uncomfortable to watch someone struggle with something you built. It’s also the fastest way to find the fix.
Heatmaps and click-tracking fill the middle ground between raw analytics and full interviews. They show where attention concentrates on a page and, just as usefully, where it doesn’t. A CTA button that nobody’s cursor ever reaches is a design problem heatmap data will catch before a single A/B test confirms it.
None of these qualitative methods replace testing. They tell you what to test in the first place, which is often the harder problem.
How CRO Fits Into Your Broader Marketing and UX Strategy
Conversion rate optimization doesn’t work well as an isolated project bolted onto a marketing calendar. It works best woven into how SEO, paid campaigns, and site design already operate.
SEO and CRO share a natural feedback loop. Organic traffic that lands on a poorly optimized page wastes months of ranking work; a page optimized for conversions but invisible in search results wastes the opposite investment. The two need to move together, particularly for local service businesses in Scottsdale competing for the same handful of high-intent searches.
PPC campaigns depend on conversion optimization even more directly, since every wasted click has a hard dollar cost attached. A landing page that improves from 2% to 4% conversion cuts effective cost per lead in half without touching the ad budget at all, which is why message match between ad copy and landing page headline deserves attention before adjusting bids.
UX and CRO overlap almost entirely at the tactical level, but they diverge in mindset. UX designers often optimize for a pleasant, frictionless experience broadly. CRO asks a narrower question: does this specific change move a specific metric. The best programs let UX principles guide the direction of a test while letting data decide whether it actually worked. A redesign that looks better in a mockup but performs worse in a live test still loses.
Content strategy plugs in too. Blog posts, case studies, and service pages that build trust upstream often show up as improved conversion rates downstream, even when nobody directly measures the connection. Treating content, SEO, PPC, and CRO as separate departments with separate goals is how businesses end up optimizing one channel while quietly undermining another.
Post-Test Analysis: How to Act on Results Without Fooling Yourself
Ending a test is not the same as understanding it. This is where most conversion optimization techniques quietly fall apart.
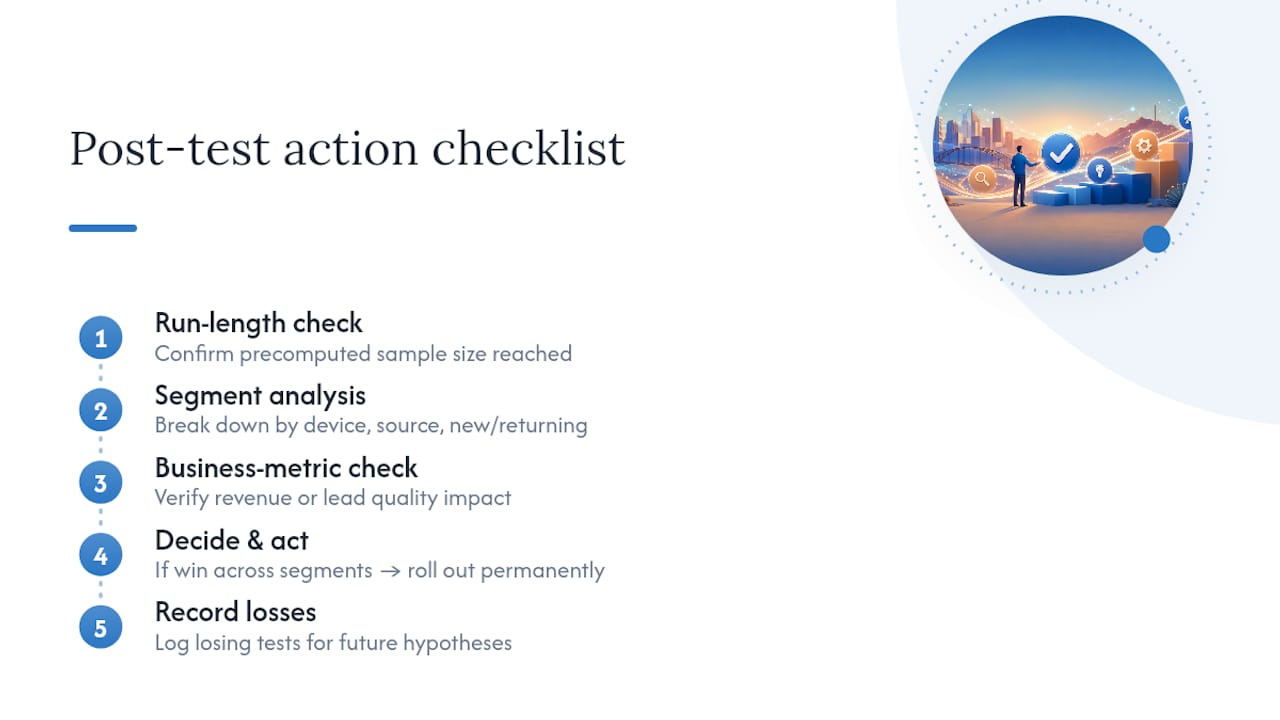
The first check: did the test run long enough to reach the sample size calculated before launch. A test stopped early because a variant looked like it was winning is the single most common source of false positives in CRO programs. Statistical significance calculated on partial data isn’t significance, it’s noise that happened to look like a pattern.
The second check: segment the results before trusting the headline number. A variant that wins overall but loses among your highest-value traffic source, say, direct visitors who already know your brand, isn’t actually a win. Break results down by device, traffic source, and new versus returning visitor before declaring victory.
The third check: look past the primary metric to the metric that actually pays the bills. A form redesign that increases submissions but drags down lead quality has failed even if the dashboard shows green. Tie every test back to revenue or qualified leads before rolling it out sitewide.
When a test wins cleanly across the segments that matter, document the result in a shared record, what was tested, what changed, by how much, and roll the winning variant out permanently. When a test loses or shows no clear signal, resist the urge to quietly ignore it. A documented loss still tells you something about your visitors that the next hypothesis should account for. Programs that only log wins end up repeating the same losing ideas in new packaging.
Author Perspective: The Governance Gap Nobody Talks About
Most CRO programs don’t fail from bad ideas. They fail from no system to catch bad decisions. Ad-hoc testing without a hypothesis library means teams retest the same failed idea eighteen months later. Ignoring lead quality in favor of raw conversion count optimizes for the wrong outcome entirely.
A working program needs three things: a written hypothesis library so nobody repeats a dead idea, a fixed reporting cadence so results don’t vanish into a Slack thread, and one person accountable for the testing calendar. Start with your highest-friction, highest-traffic pages. Everything else can wait.
— Brett
How Webtechs Helps Scottsdale Businesses Turn Traffic Into Customers
Webtechs is the practical alternative to guessing your way through conversion fixes: instead of a generic redesign, you get an audit built around where your specific visitors actually drop off, checkout friction, message mismatch, slow load times, then a prioritized roadmap to fix it.
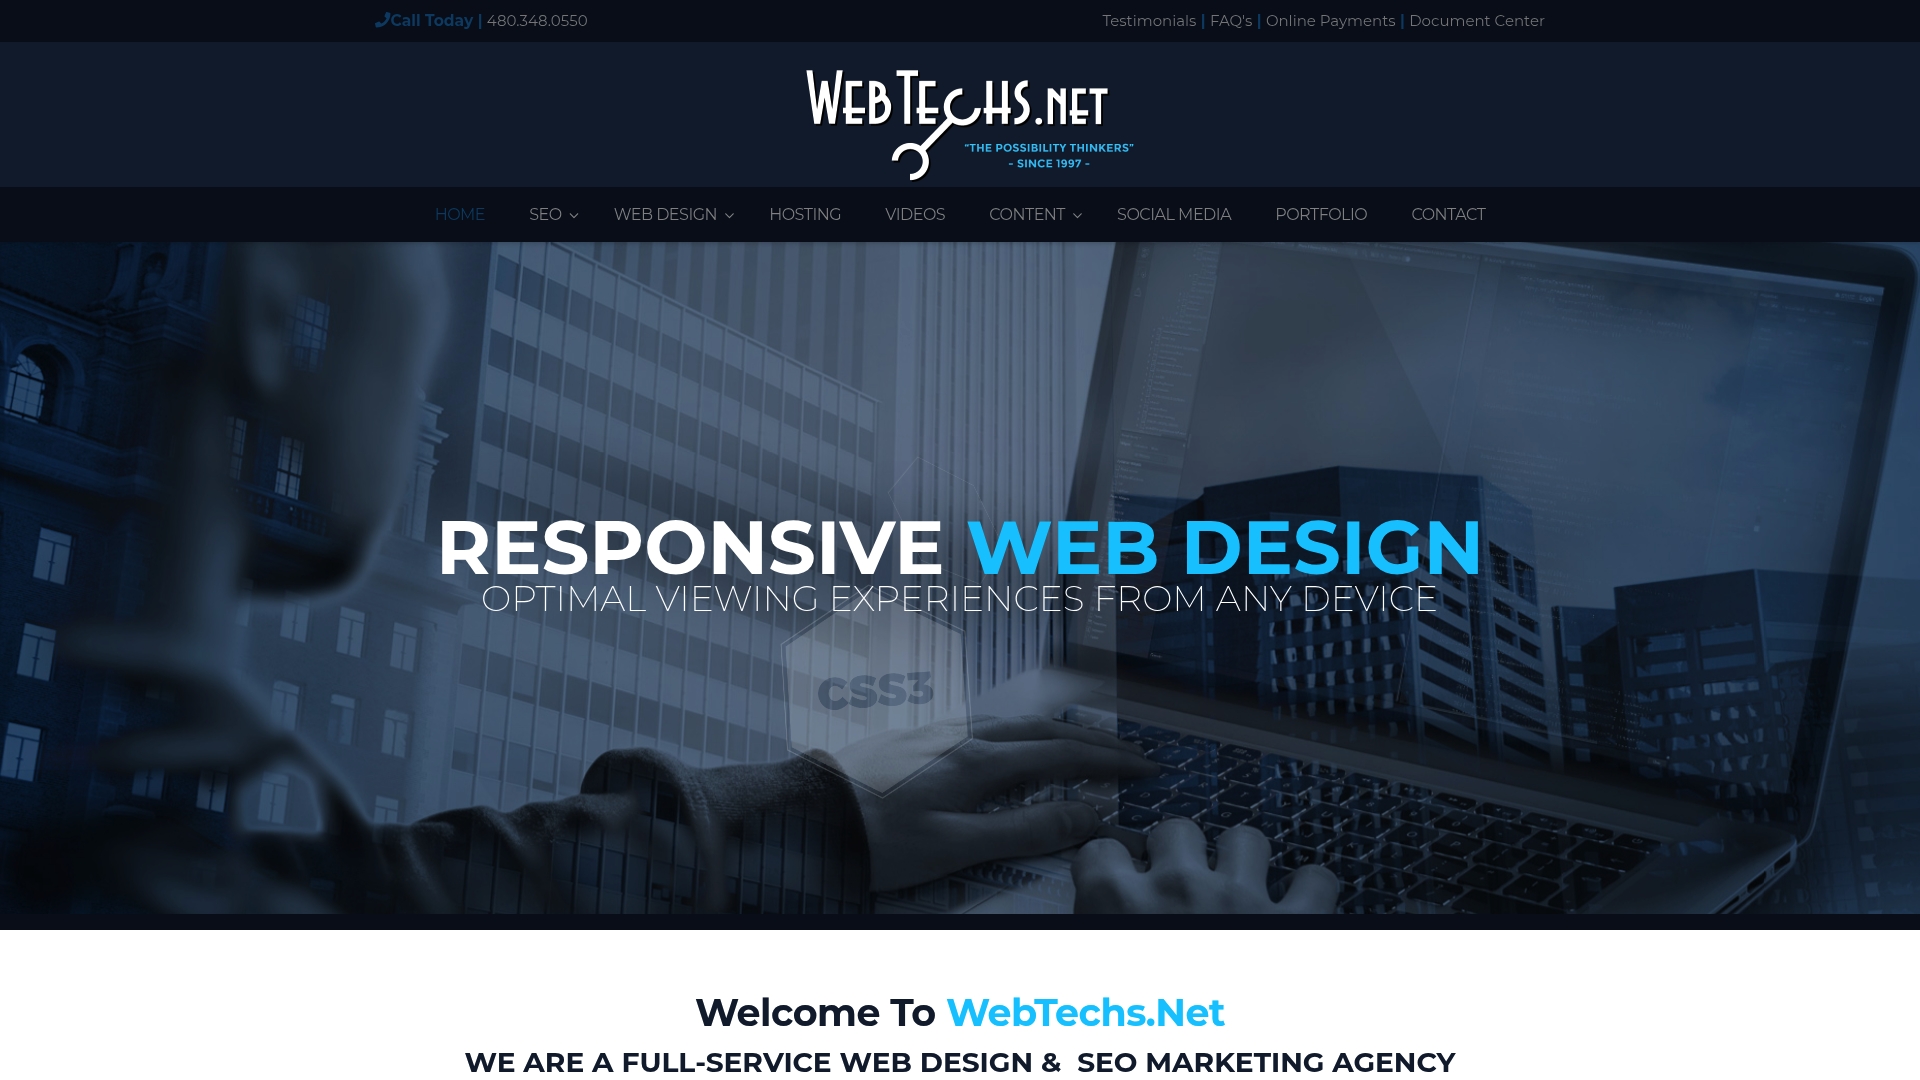
Since 1997, Webtechs has worked with small and mid-sized businesses across Scottsdale and the broader Arizona market on projects ranging from full website design to ongoing SEO and PPC management. The RV Insurance case study shows the kind of measurable lift possible when conversion work and search visibility are handled together instead of as separate line items.
A conversion audit from Webtechs looks at page speed, checkout or form friction, message match between your ads and landing pages, and a prioritized list of what to fix first, the same framework covered above, applied to your actual site and your actual traffic. If you’re ready to see where your site is losing conversions, browse the Webtechs portfolio and request an audit to get a roadmap built around your numbers, not industry averages.
Sources
- Conversion rate optimization (Salesforce)
- Landing page optimization tips (Shopify)
- Conversion rate guide — Search Engine Land
- Conversion Rate Optimization — Backlinko