
Website Heatmap Analysis for Scottsdale Small Businesses
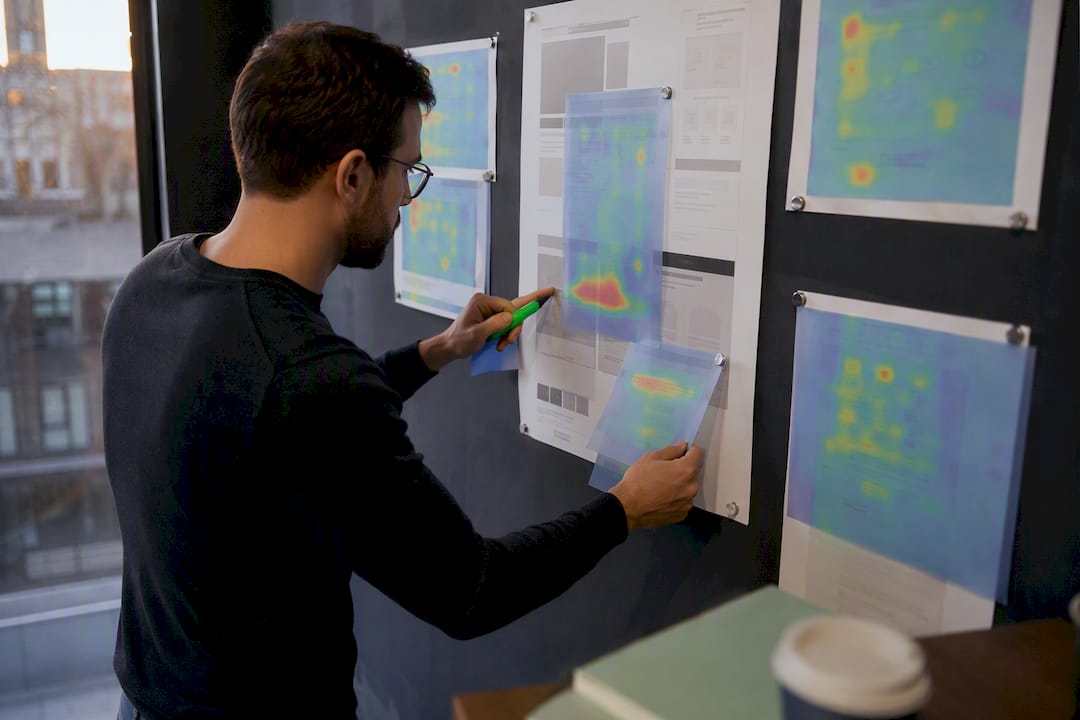
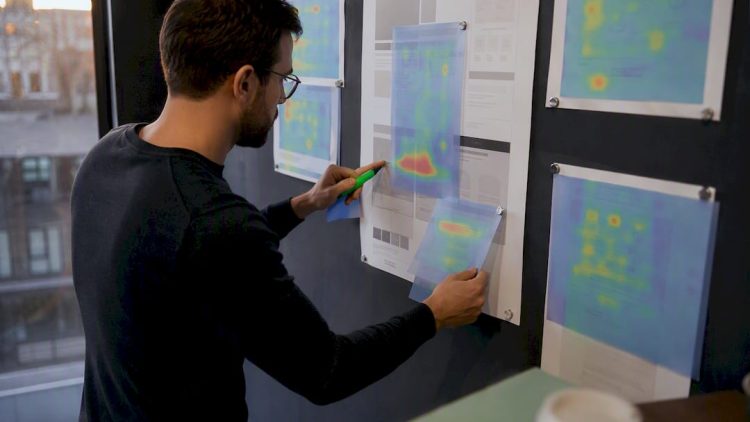
Website heatmap analysis shows exactly where visitors click, how far they scroll, and which sections hold their attention, so you can fix friction points instead of guessing at redesigns. It works by overlaying color on your actual pages, using real visitor sessions, not surveys or hunches.
If you run a Scottsdale business, your first move this week is simple: pick one to three high-value pages, your main landing page, your top service page, or your contact/booking form, and get a heatmap running on them before you touch anything else. Tools like Microsoft Clarity and Amplitude install with a small script, and you’ll have usable data within days. Add heatmap tracking properly and you avoid the GDPR-style privacy pitfalls that trip up US businesses collecting visitor data on booking pages, and if you’d rather hand the whole thing off, WebTechs.Net runs this locally in Scottsdale.
Your one-week quick start looks like this:
- First days: Pull your Google Analytics data and flag pages with high traffic but low conversion.
- Next days: Install a heatmap tool on those pages and let sessions accumulate.
- Final days: Read the results, write one hypothesis, and plan your first test.
Pro Tip: Don’t heatmap your homepage first just because it gets the most traffic. Heatmap the page closest to the sale, your booking form or quote request, because that’s where a small fix produces the fastest revenue change.
Key Takeaways
Website heatmap analysis turns guesswork into a fixable list of friction points when you pair click and scroll data with a real hypothesis and an A/B test.
| Point | Details |
|---|---|
| Pick pages by data, not instinct | Use GA4 to target high-traffic, low-conversion, or high-bounce pages first. |
| Run heatmaps for three to five days minimum | Shorter windows miss patterns like rage clicks and scroll drop-off. |
| Always pair heatmaps with a hypothesis | Turn every dead click or scroll cliff into one testable statement, then A/B test it. |
| Check privacy settings on booking pages | Favor privacy-first tools like Cloudflare Web Analytics when collecting contact data. |
| Local agency option available | WebTechs.Net combines heatmap analysis with implementation and testing for Scottsdale businesses. |
Tools and docs to start your heatmap analysis
- Microsoft Clarity: free heatmaps and session recordings, best starting point for any budget.
- Amplitude Heatmaps: use when you need funnel and journey integration alongside click data.
- Zoho PageSense: heatmaps plus built-in A/B testing in one tool.
- Umami heatmap docs: lightweight, self-hosted option for privacy-conscious setups.
- Contentsquare: zone-based analysis for higher-traffic enterprise sites.
- Effective CTA design guidance for fixing the buttons your heatmaps flag as ignored.
- WebTechs.Net’s website design services for Scottsdale businesses that want the analysis and the fix handled together.
Table of Contents
- What Is the Four-Step Heatmap Analysis Workflow?
- Should You Hire an Agency or Run Heatmaps Yourself?
- Sources
What Is the Four-Step Heatmap Analysis Workflow?
Heatmap analysis works best as a repeatable cycle, not a one-time report you glance at and forget. The standard four-step process moves from analytics to hypothesis to test, and you can run it in a single week for one page.
- Identify the page. Use Google Analytics or GA4 to find pages with high bounce rates, high traffic paired with low conversion, or a specific landing page tied to a paid campaign. This takes an hour or two, not days.
- Run the heatmap and session replay. Install your chosen tool and let it collect data for three to five days minimum. Click maps show exact tap and click locations. Scroll maps reveal how far people actually read before abandoning the page. Selector or attention maps highlight which specific elements draw the eye, and rage clicks (repeated frantic clicking) flag broken or confusing buttons.
- Form a hypothesis. Look for dead clicks on non-interactive elements, a classic sign visitors expect something to be clickable and it isn’t, and scroll drop-off points above key content. Write one specific, testable statement: “Moving the phone number above the fold will reduce bounce on mobile.”
- Implement and A/B test. Make the change, then validate it with an A/B test rather than assuming the fix worked.
Quick timeline box: One page, one week. Day 1 setup, days 2-4 data collection, day 5 analysis, days 6-7 build and launch your test. This matches the sprint approach many CRO teams already run.
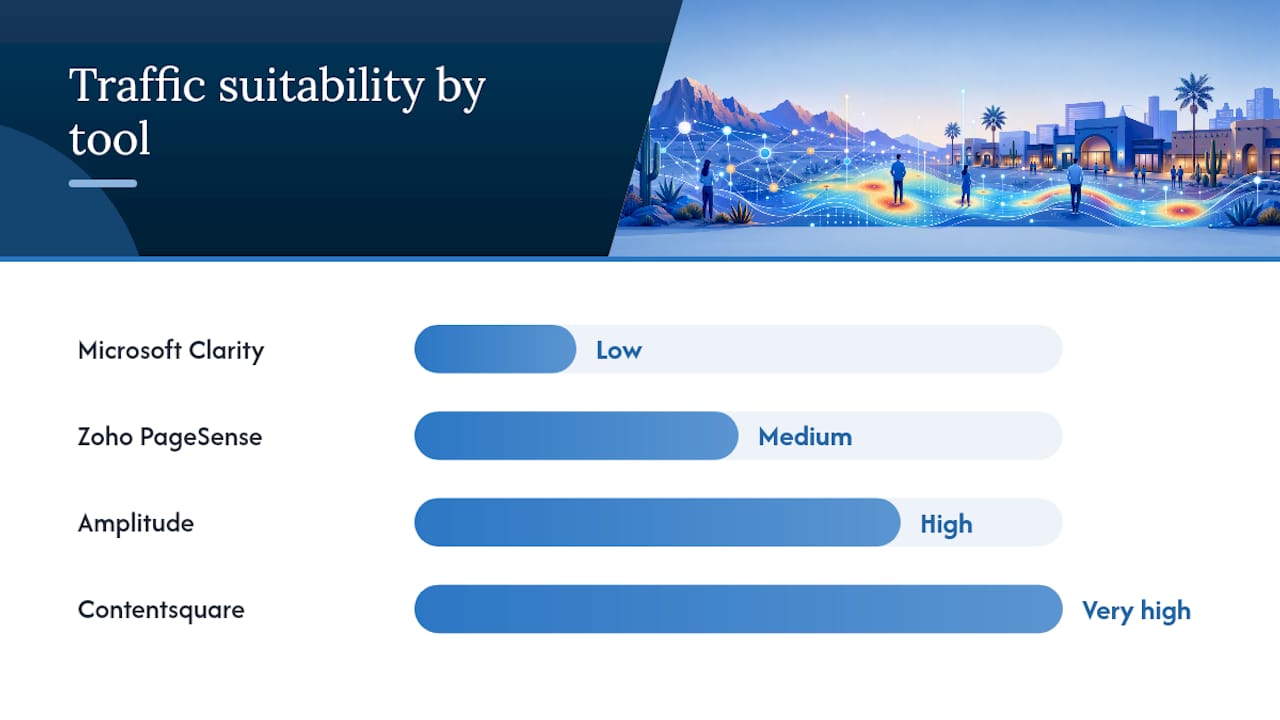
Tool choice depends on your budget and complexity needs. Microsoft Clarity is free and gets you heatmaps plus session recordings immediately. Amplitude adds funnel and journey integration if you’re already tracking user paths. Zoho PageSense sits in between, offering heatmaps with built-in A/B testing. Contentsquare and similar zone-based platforms tie specific page elements directly to revenue, but that level of depth usually only pays off once you have real traffic volume to analyze.
A local agency’s take on Scottsdale heatmap patterns
Across the Scottsdale service businesses we’ve worked with, the same problem shows up again and again: visitors scroll past the phone number, hover over a testimonial that isn’t clickable, then leave. Heatmaps catch that in a week; guessing at a redesign can take months. Our SEO case studies show what happens when that friction actually gets fixed instead of just noticed.
Should You Hire an Agency or Run Heatmaps Yourself?
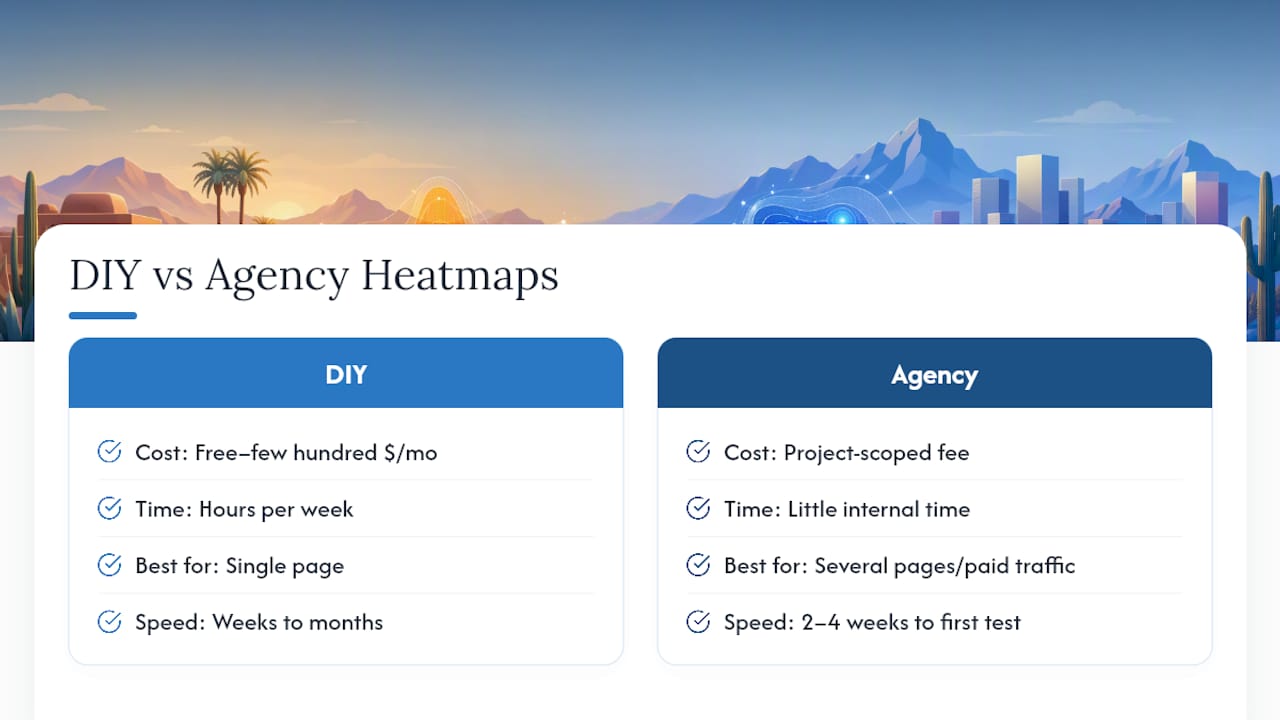
Running heatmap tools yourself costs little beyond your own time, often nothing if you stick with Microsoft Clarity, but it demands hours each week to read sessions, spot patterns, and build tests correctly. If you’re comfortable in analytics and have a few hours weekly, DIY works fine for a single page.
Hiring out makes more sense once you’re managing several pages, running paid traffic where every day of confusion costs money, or you simply don’t have someone on staff who reads heatmap data well. WebTechs.Net handles heatmap-driven UX testing, A/B test setup, landing page redesign, and analytics integration together, so the insight and the fix happen under one roof instead of stalling between “here’s the data” and “who fixes it.”
DIY typically runs free to a few hundred dollars a month in tool costs, spread across weeks of your own time. Agency engagements move faster, usually delivering a first round of findings and a live test within two to four weeks, at a cost tied to project scope. Check the website design price list to see how that scope typically breaks down.
Before you sign with anyone, ask three questions: Do they combine heatmaps with session replay and funnel data, or just hand you colored screenshots? Do they show local case studies, not just generic templates? And will they actually implement the fix, or just deliver a report and disappear? Ask about ongoing testing cadence, too. A one-time heatmap audit with no follow-up is one of the biggest wastes of a CRO budget. If a provider skips combining heatmaps with funnel data, treat that as a red flag, not a shortcut. Visit our portfolio to see completed Scottsdale projects, or check client testimonials for feedback from businesses that went the agency route. Get started by requesting a quote through Professional Web Design and tell us which pages are underperforming.
Sources
- Zoho PageSense — Analyze heatmap
- Microsoft Clarity – Free Heatmaps & Session Recordings
- Website Heatmap Tool by Amplitude | Amplitude
- Umami — Heatmaps documentation
- Cloudflare Web Analytics